Linux configuration audit and security review tool — for ethical and defensive use only.
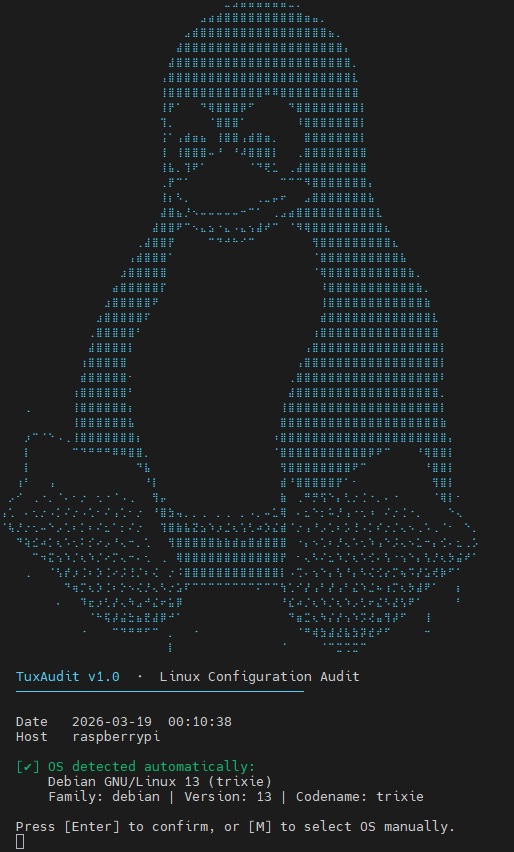
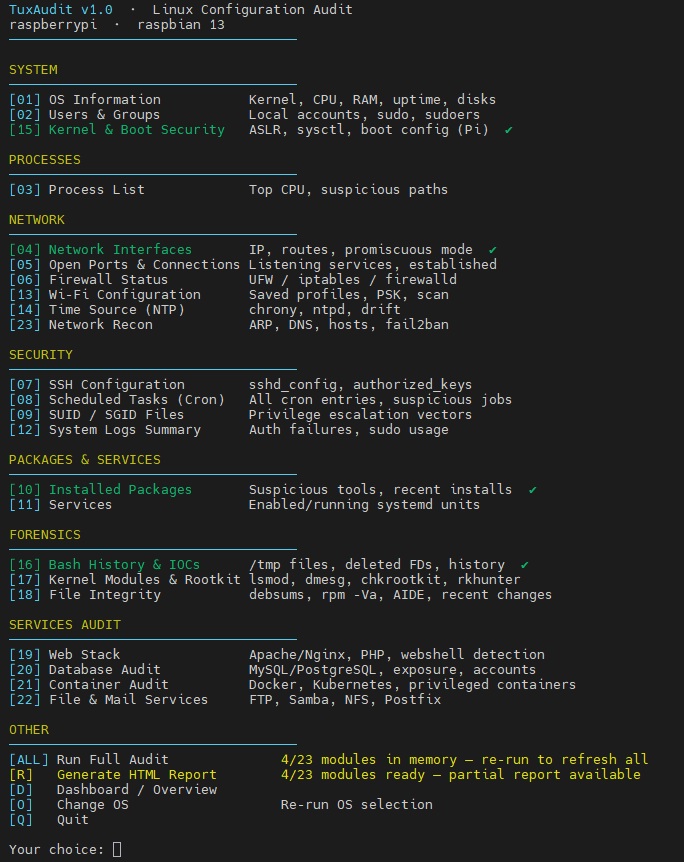
TuxAudit is a Bash script designed for Blue Team analysts, system administrators, and security auditors. It provides a rapid snapshot of a Linux machine's configuration, identifies deviations from security best practices, and generates an interactive HTML report ready for immediate use.
The script contains no write, modify, or exploitation commands. It relies exclusively on read-only calls (cat, find, ss, ps, systemctl, etc.) and does not alter the audited system in any way.
The author of this script cannot be held responsible for its use. TuxAudit is designed to be used only on systems you own or for which you have explicit written authorization. Any use on a third-party system without authorization is illegal and unethical. This script contains only read commands and does not modify, exfiltrate, or alter any system data.
The script requires root privileges to access certain system information (shadow file, audit logs, kernel parameters, etc.).
sudo bash tuxaudit.shThe script must be run as root or via sudo. It will refuse to start otherwise.
- Bash 4.0 or later
- Standard GNU/Linux utilities:
awk,sed,find,ss,ps,systemctl - Optional (for enhanced modules):
chkrootkit,rkhunter,debsums,aide,fail2ban
| # | OS | Versions |
|---|---|---|
| 1 | Raspberry Pi OS | Debian 12 Bookworm / 13 Trixie |
| 2 | Debian | 11 Bullseye / 12 Bookworm |
| 3 | Ubuntu | 22.04 Jammy / 24.04 Noble |
| 4 | RHEL / CentOS | 8 / 9 |
| 5 | Fedora | 39 / 40 |
# Make executable
chmod +x tuxaudit.sh

# Run as root
sudo bash tuxaudit.sh[ALL] → Runs all 23 modules, output scrolls live, data captured automatically
[R] → [SEL] Generate HTML report from captured data
The report is saved in /tmp/ as:
tuxaudit_HOSTNAME_YYYY-MM-DD_HH-MM.html
To open the report from another machine on the network:
python3 -m http.server 8080 --directory /tmp
# Then browse to: http://<machine-ip>:8080/tuxaudit_HOSTNAME_...htmlRuns all 23 audit modules sequentially. Each module's output scrolls live in the terminal while being captured simultaneously. The HTML report is generated automatically at the end without any additional step.
Lets you generate the report from data already captured by [ALL], or re-run all modules on demand.
| Choice | Action |
|---|---|
ALL |
Re-run all 23 modules and generate report |
SEL |
Use already-captured data from the current session |
Q |
Cancel |
Runs a single module and displays the result directly in the terminal, without generating an HTML report. Useful for quick checks or targeted diagnostics.
Displays a full machine overview in the console:
- System information (OS, kernel, CPU, RAM, uptime, board model for Raspberry Pi)
- Disk usage with color-coded fill status
- Local accounts (UID, shell, root flag)
- Path of the last generated report
Re-runs OS detection and lets you select the target OS manually if auto-detection fails.
| # | Description | Category |
|---|---|---|
| 01 | OS Information — kernel, CPU, RAM, uptime, disks | System |
| 02 | Users & Groups — local accounts, UID=0, sudo, sudoers | Security |
| 03 | Process List — top CPU, suspicious paths | Processes |
| 04 | Network Interfaces — IP, routes, promiscuous mode | Network |
| 05 | Open Ports & Connections — listening services, established | Network |
| 06 | Firewall Status — UFW / iptables / firewalld | Security |
| 07 | SSH Configuration — sshd_config, authorized_keys | Security |
| 08 | Scheduled Tasks (Cron) — all cron entries, suspicious jobs | Security |
| 09 | SUID / SGID Files — privilege escalation vectors (host only, Docker layers excluded) | Security |
| 10 | Installed Packages — suspicious tools, recent installs | Packages |
| 11 | Services — enabled/running systemd units | Packages |
| 12 | System Logs Summary — auth failures, sudo usage | Security |
| 13 | Wi-Fi Configuration — saved profiles, PSK, scan | Network |
| 14 | Time Source (NTP) — chrony, ntpd, drift | Network |
| 15 | Kernel & Boot Security — ASLR, sysctl, boot config (Pi) | System |
| 16 | Bash History & IOCs — /tmp files, deleted FDs, suspicious commands | Forensics |
| 17 | Kernel Modules & Rootkits — lsmod, dmesg, chkrootkit, rkhunter | Forensics |
| 18 | File Integrity — debsums, rpm -Va, AIDE, recently modified binaries | Forensics |
| 19 | Web Stack Audit — Apache/Nginx, PHP, webshell detection | Services |
| 20 | Database Audit — MySQL/PostgreSQL, exposure, accounts | Services |
| 21 | Container Audit — Docker, Kubernetes, privileged containers | Services |
| 22 | File & Mail Services — FTP, Samba, NFS, Postfix | Services |
| 23 | Network Recon — ARP, DNS, hosts, fail2ban | Network |
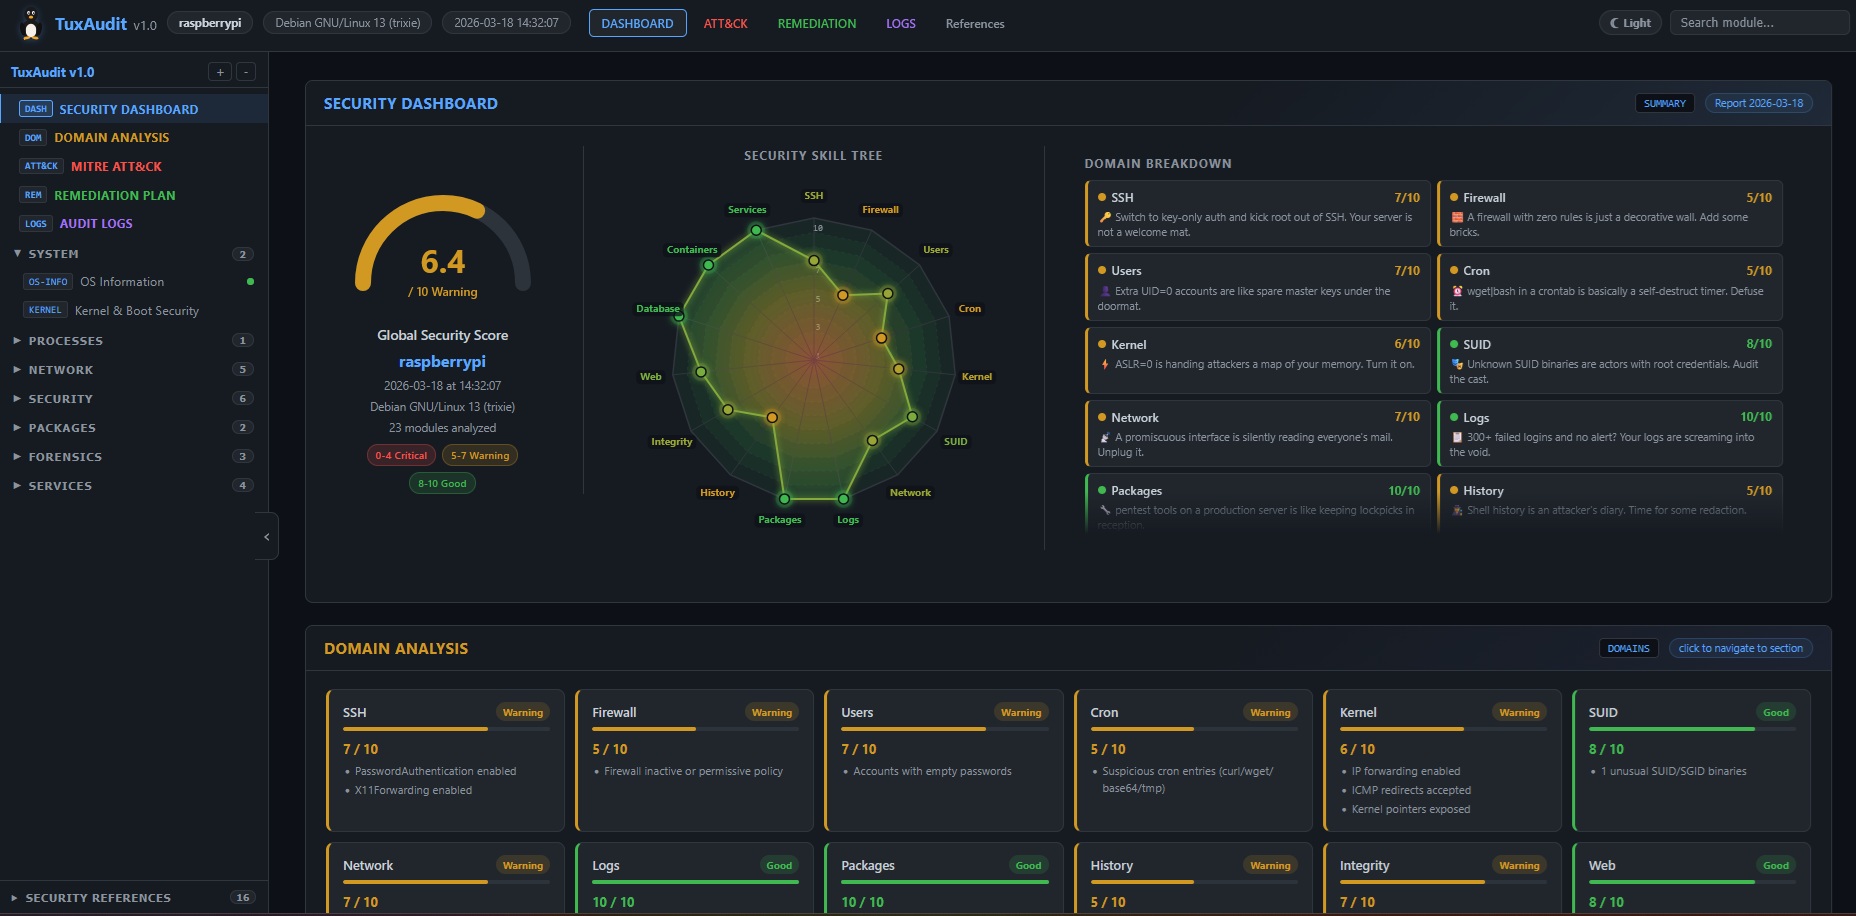
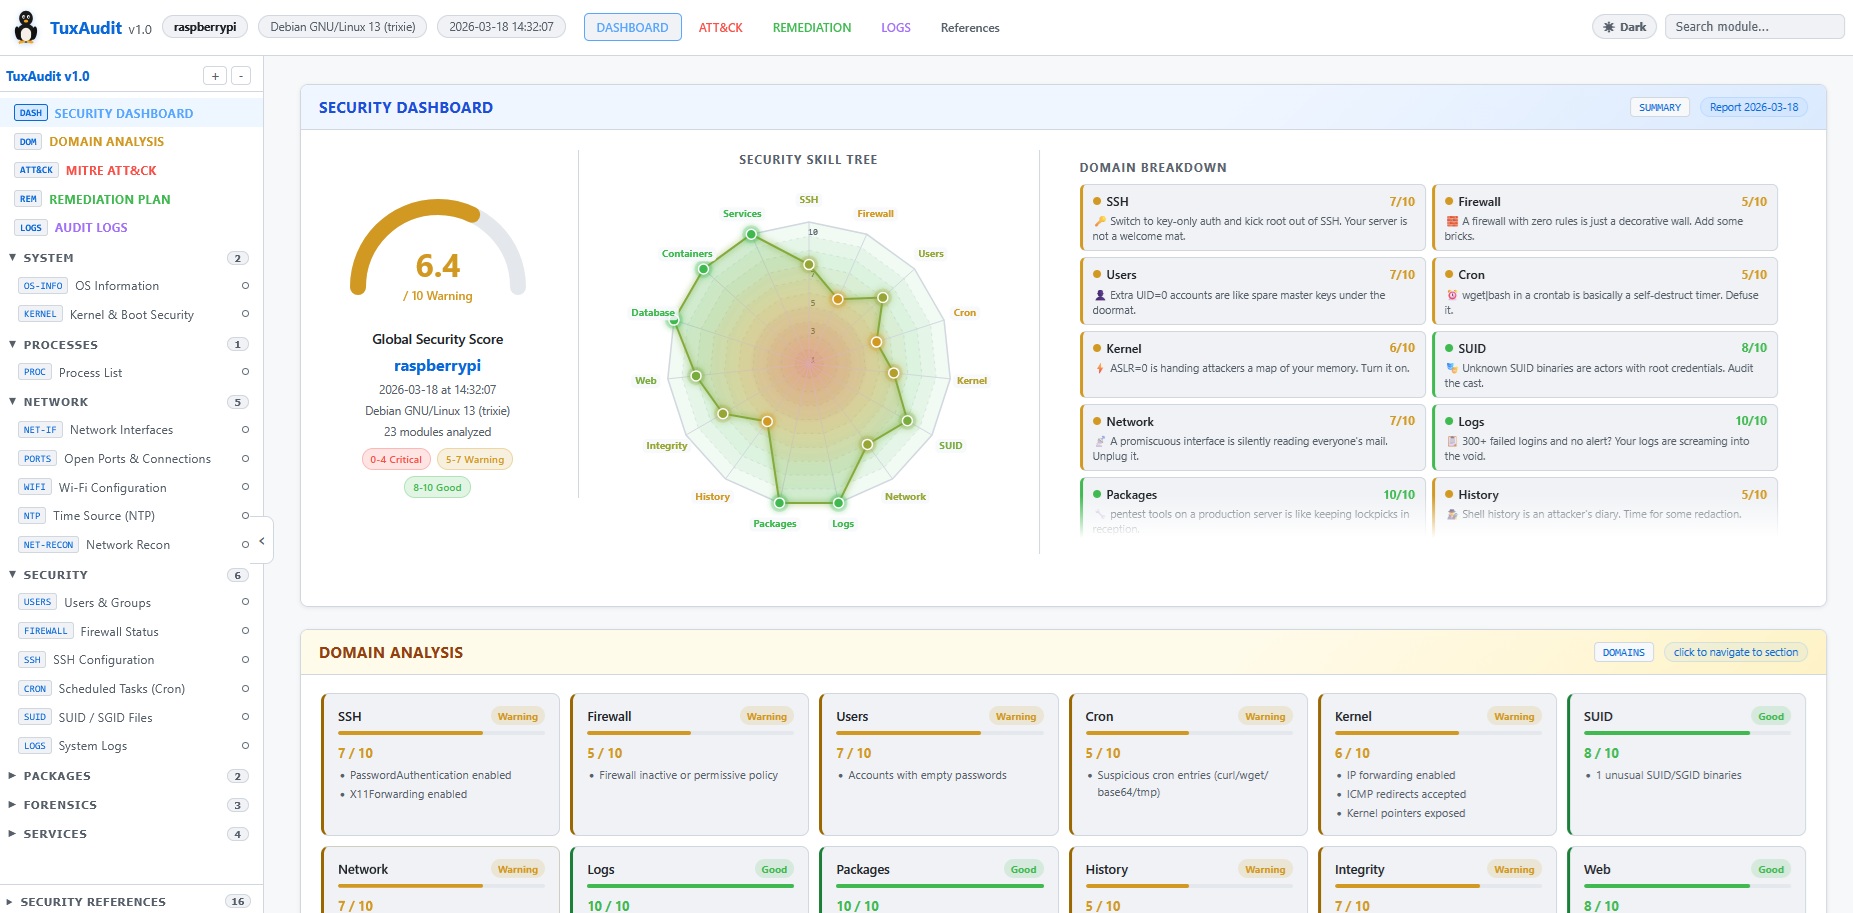
The generated report is a self-contained HTML file (no external dependencies, no internet required) containing:
- Security Dashboard with global score gauge, RPG-style radar chart (Security Skill Tree) per domain, and a domain breakdown with improvement tips
- Domain Analysis — 15 clickable cards with score bars, issue lists, and navigation links to each audit section
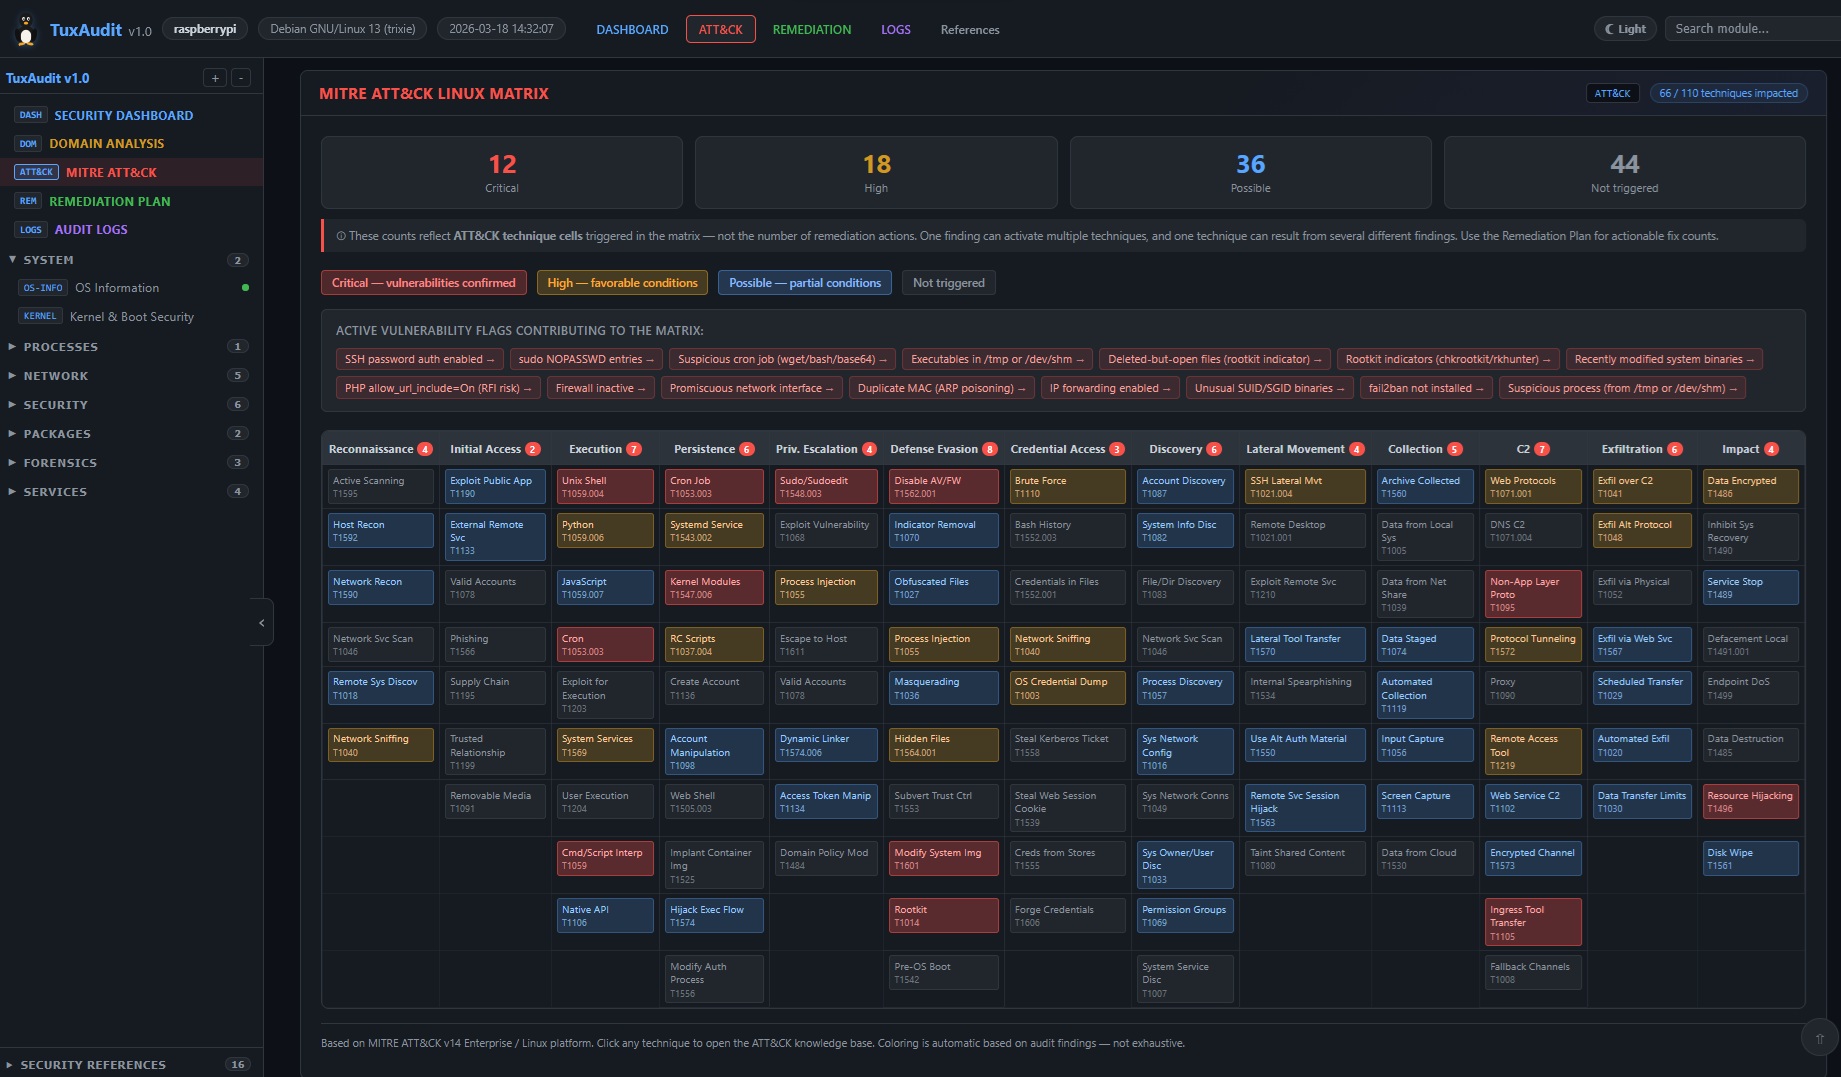
- MITRE ATT&CK Linux Matrix — detected techniques highlighted by risk level; clicking a technique opens the official page on attack.mitre.org
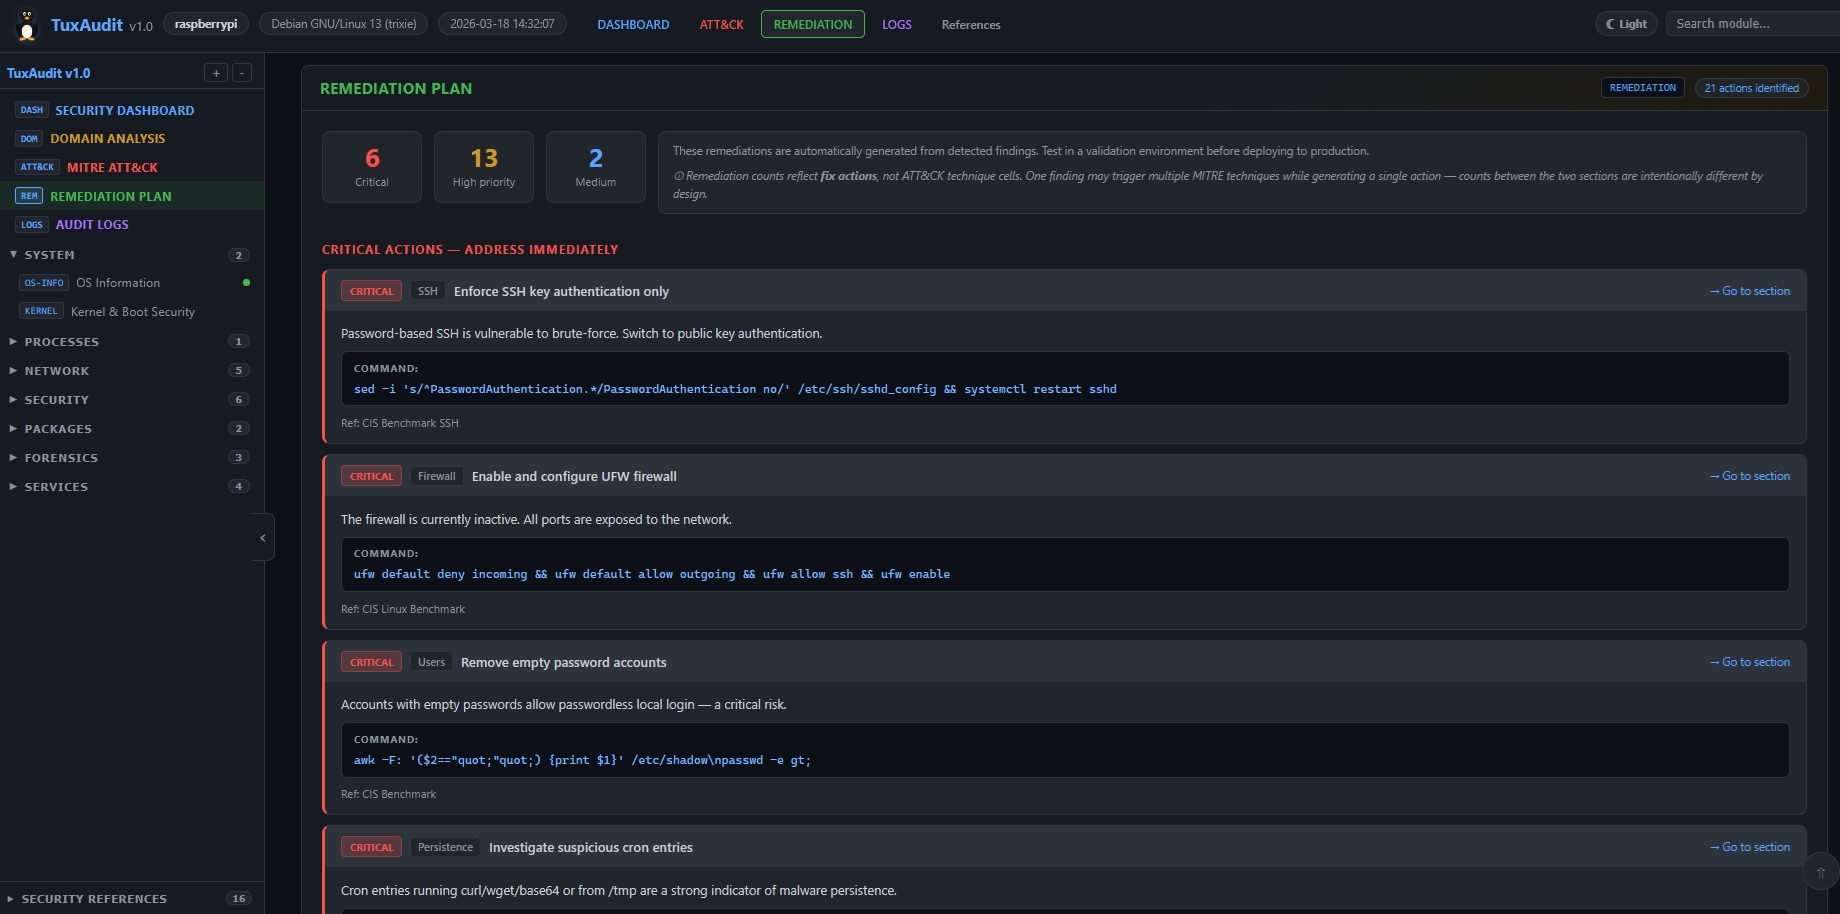
- Remediation Plan prioritized by criticality (Critical / High / Medium) with copy-ready bash commands
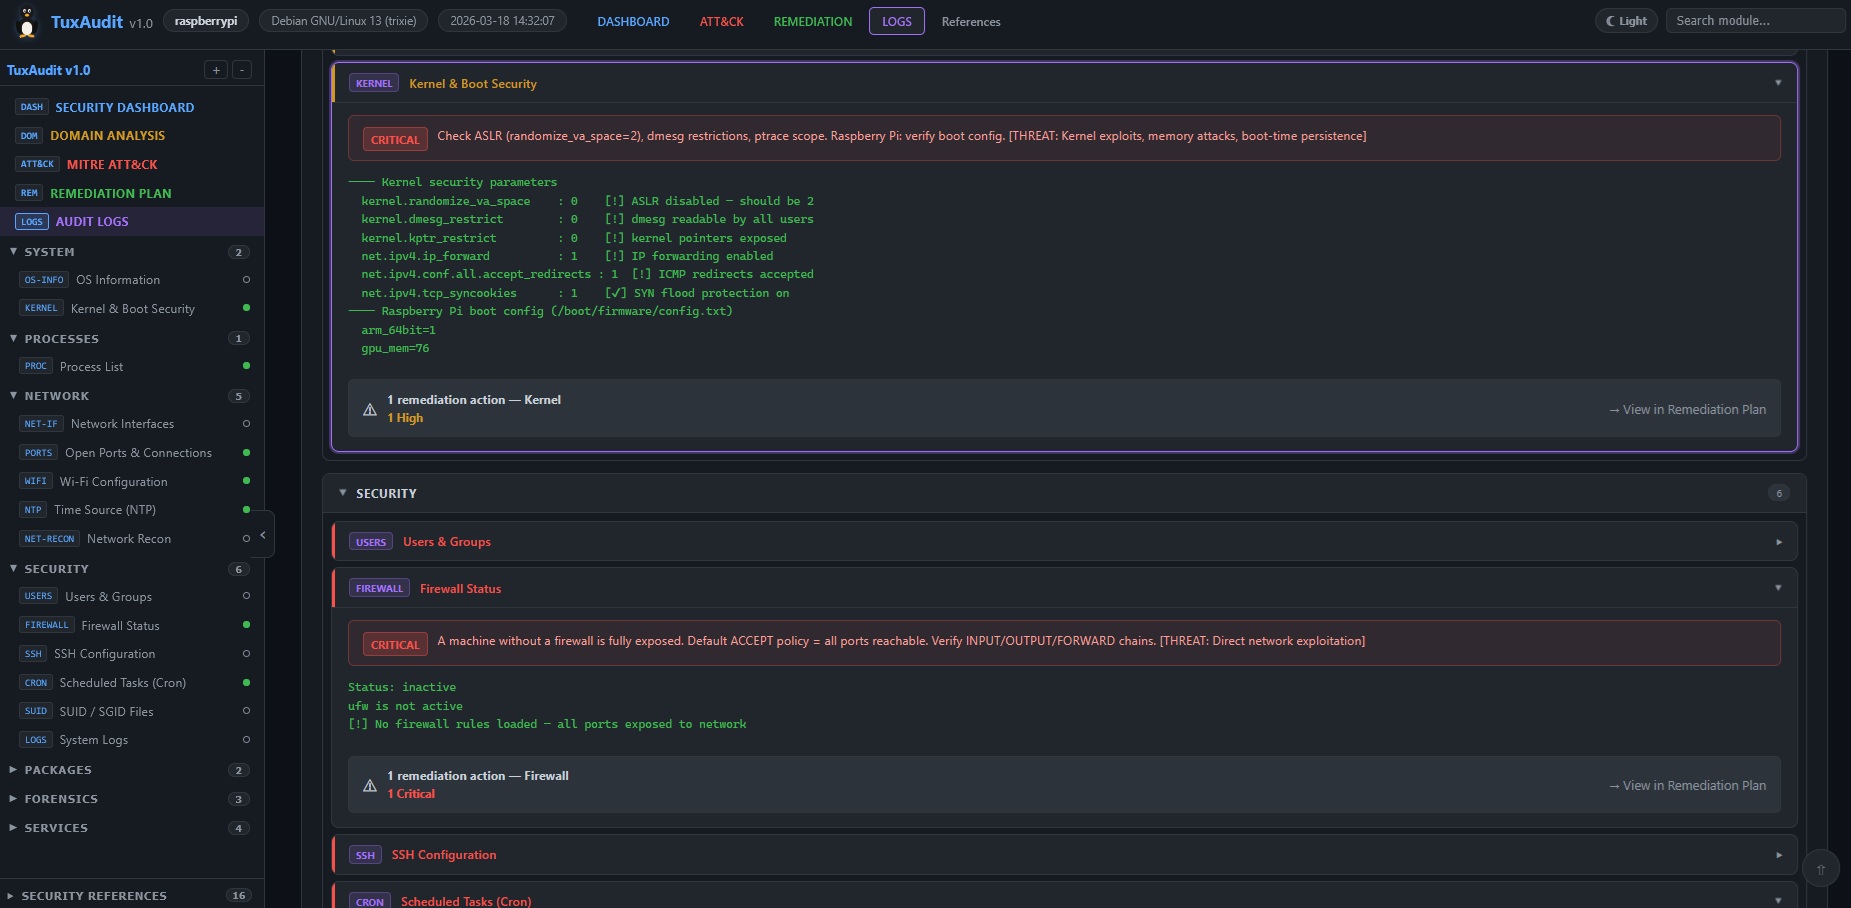
- Detail of each module with raw output and security recommendations
- Sidebar navigation with search, category filters, and security references
- Light / Dark theme toggle with localStorage persistence
The score is not a simple average. It is calculated using a formula inspired by CVSS:
Risk(domain) = Impact × Exploitability
  Impact         = domain_weight / 4        (normalized 0.25 → 1.0)
  Exploitability = (10 - domain_score) / 10

Raw score = 10 - (average_risk × 10)
Punitive ceilings — certain critical domains in failure lock the global score regardless of other modules:
| Condition | Ceiling | Meaning |
|---|---|---|
| Critical domain (weight ≥ 4) at ≤ 2/10 | 3.9 | e.g. Webshell detected → Critical certain |
| Critical domain (weight ≥ 4) at ≤ 4/10 | 4.9 | Severe failure on vital domain |
| Critical domain (weight ≥ 4) at ≤ 6/10 | 6.4 | Partial failure on vital domain |
| Important domain (weight ≥ 3) at ≤ 2/10 | 4.9 | Major failure |
| Important domain (weight ≥ 3) at ≤ 4/10 | 5.9 | Significant failure |
Critical domains (weight 4): SSH, Firewall, Integrity, Web, Database.
Coverage penalty — a partial audit (few modules analyzed) pulls the score toward 5/10 to reflect uncertainty.
Display thresholds:
| Score | Label | Color |
|---|---|---|
| 0 – 4.9 | Critical | Red |
| 5.0 – 7.9 | Warning | Orange |
| 8.0 – 10 | Good | Green |
The report includes a collapsible reference panel in the sidebar linking to:
- CIS — Debian Linux Benchmark, Ubuntu Linux Benchmark, Controls v8
- NIST — Cybersecurity Framework 2.0, SP 800-123, SP 800-53 Rev5
- MITRE — ATT&CK Linux Matrix, Mitigations, GTFOBins
- CISA — Known Exploited Vulnerabilities (KEV) Catalog
- Debian — Securing Debian Manual
- Canonical — Ubuntu Security Guide (USG)
- NIST NVD — CVE Database
Apache 2.0 — see LICENSE file.
Anadema